#Feats Thru Sheets An interactive, filterable, searchable database of people and events that can be reskinned for different types of stories and updated solely by reporters.
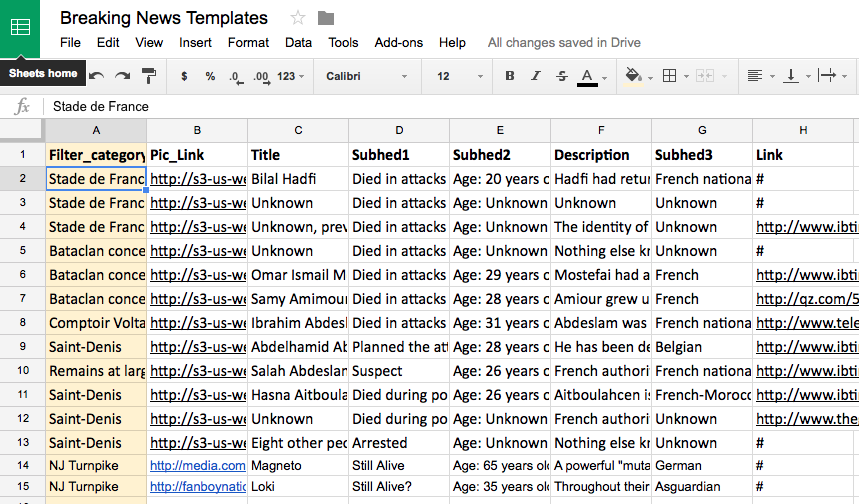
We've created a template connecting the front-end to a back-end Google Spreadsheet using tabletop.js. They can be customized by developers, and reporters can add content and images in a Google Spreadsheet and all changes will be reflected in real time. This is ideal for breaking news situations.
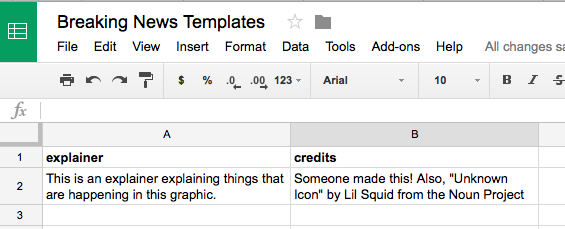
Reporters can also change titles, explainer text and credits. In addition, the database has a timestamp that chronicles the last time a reporter updated the database.
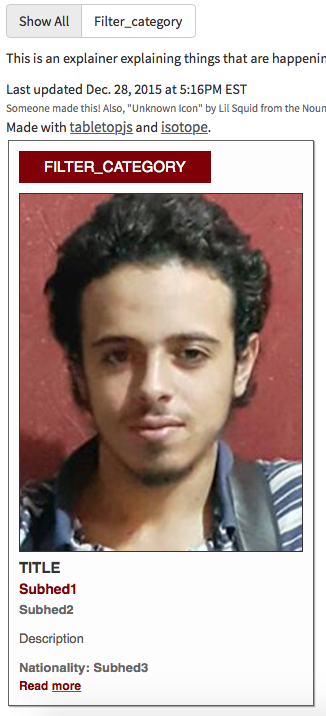
Check out what it looks like
... Which is powered through this Spreadsheet
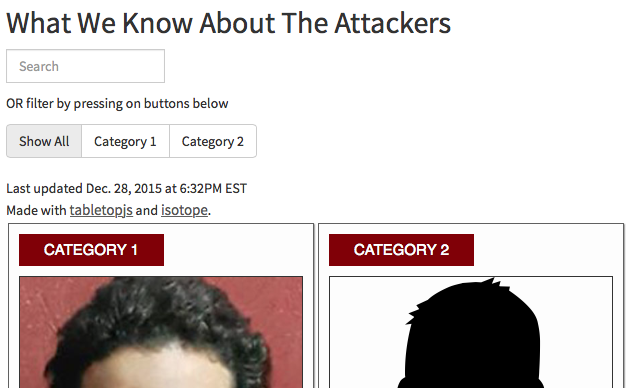
There's also a filter button and search option for the readers that brings up certain data. The transitions were created using Isotope.js.
How we've used it and customized it:
###Skip to:
##Set it up
Create a new copy of this Google Spreadsheet into your Google Drive. Then, go to the File menu and click on Publish to the web. Clicking on Start Publishing will make a URL like this appear:
https://docs.google.com/spreadsheets/d/1Jn4I3FIerKG5UGJSq3c3bEDs_V_9OxIGUnJ-Bu-3vEQ/pubhtml
Copy only the part between the /d/ and the /pubhtml. In the example above, that would be:
1Jn4I3FIerKG5UGJSq3c3bEDs_V_9OxIGUnJ-Bu-3vEQ
Pick the template you'd like to use. Open up the js folder and find the init.js file.
Paste your Google Spreadsheet code to var public_spreadsheet_url.
var public_spreadsheet_url = '1Jn4I3FIerKG5UGJSq3c3bEDs_V_9OxIGUnJ-Bu-3vEQ';And that's it! You've officially connected your Google Spreadsheet
If you want to customize what shows up in the database or let it show other columns, you can customize it here within the same js file. This is the part where the resulting JSON fetched by tabletop is parsed into different divs which you can customize.
$container.append('<div id="element-item"><div class="category">' + v.filtercategory + '</div><img src="' + v.piclink + '"><div class="name">' + v.title + '</div><div class="colorsubhed">' + v.subhed1 + '</div><div class="boldsubhed">' + v.subhed2 + '</div><div class="description">' + v.description + '</div><div class="boldsubhed">Nationality: ' + v.subhed3 + '</div><div class="readmore">Read <a href="' + v.link + ' " target="_blank">more</a></div></div>');You can also change the filter button category by changing v.filtercategory to the category of your choice.
 // Gets all unique filtercategory values and puts them into an array
            if ($.inArray(v.filtercategory, result) == -1) {

                result.push(v.filtercategory);

                // Creates the filter buttons

                $('#filter').append('<button id="' + v.filtercategory + '" class="btn btn-default" data-value="choice' + count++ + '">' + v.filtercategory + '</button>')

            }
You can also change what the style of the database looks like by changing the corresponding CSS or HTML file.
##How Reporters Can Use It
Share the Google Spreadsheet with your reporters.
Let the reporters add new data to the Google Spreadsheet. Every column header corresponds to a section in the data.
For example this:
Looks like this:
The link that you put in the Google Spreadsheet will take you to that site by clicking "Read more" on the database.
It's very important that you don't change the bold headers on the Google Spreadsheet columns (unless you want to change the name of the headers, which in that case, you must also change the name of the headers in the corresponding js file)
####What about Pictures?
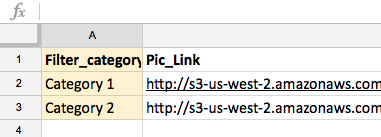
Every picture that you put on the database has to be uploaded to a server. Then add the link to the picture under the header "Pic_Link"
####Filter Categories
The header "Filter_category" in the Google Spreadsheet, highlighted in yellow, are the filter buttons at the top. You can create a new category by simply adding the new category to the "Filter category". Remember that adding too many categories will add too many buttons and won't look as good.
#####How to Change the Headline
Go to bottom of the Google Spreadsheet and change the tab name. That will automatically change the headline.
#####How to Change the Explainer and Credits
Go to bottom of the Google Spreadsheet and click on the tab called "Control". This will take you to a new spreadsheet where you can change what it says in the explainer and in the credits.
#####Now with Pym.js!
If you need to iframe in the database responsively, we now provide a template using pym.js.
##License
This project is released under the terms specified in the MIT license.

