-
Notifications
You must be signed in to change notification settings - Fork 9
Spatial consistency test
The SCT compares each observations to what is expected given the other observations in the nearby area. If the deviation is large, the observation is removed. The SCT uses optimal interpolation (OI) to compute an expected value for each observation. The background for the OI is computed from a general vertical profile of observations in the area.
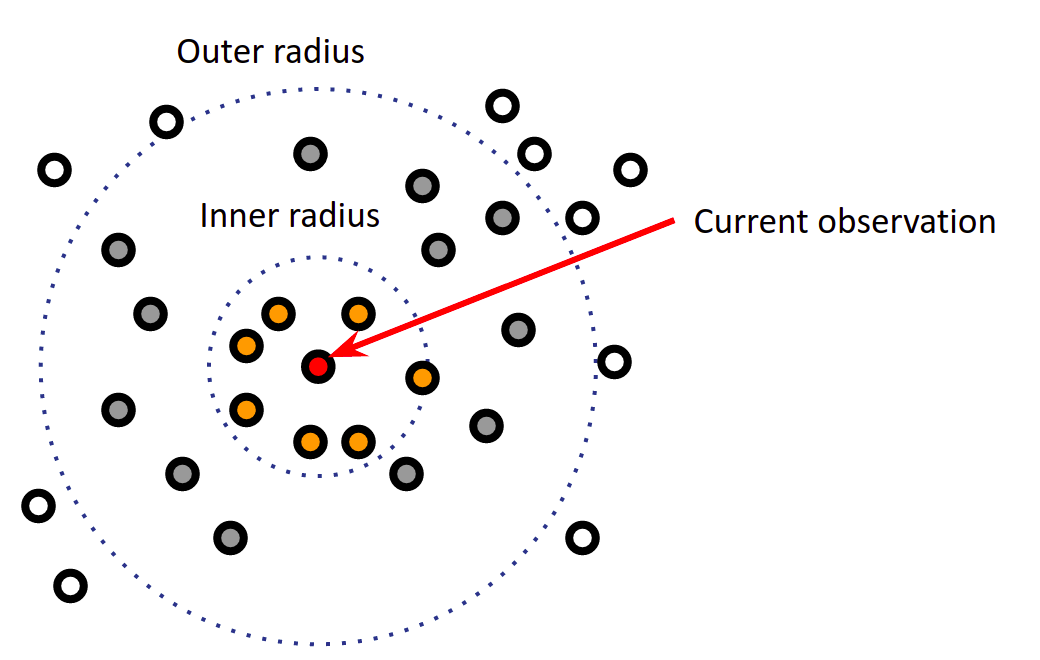
When a given observation is being processed, the outer_radius [m] defines which other observations will be used to determine if the observation should be flagged or not. This can be computationally expensive, if a new circle of observation is used when processing the next observation. To save time, the calculations used for one observation can be reused for all other observations within the inner_radius [m].
The test will only be performed if there are at least num_min observations inside the outer circle. Also,m to reduce computation time, only the nearest num_max observations will be used in the outer circle, even if there are more available observations. The SCT inverts a matrix with the same dimensions as the number of available observations, therefore preventing really large matrices in observation dense areas significantly lowers computation times.
The thresholds for determining if an observation is removed is set by pos and neg. pos sets the number of standard deviations above the expected value a given observation is allowed before being flagged. Similarly, neg is used for negative deviations. Different deviations for positive and negative are useful for sun-exposed temperature sensors in cold inversion conditions, where large negative deviations are more likely to be valid than positive ones.
An adaptive horizontal decorrelation length is determined automatically, however a minimum allowed value can be set by dhmin [m]. The vertical decorrelation lengthscale is set by dz [m].
The background for the OI is computed by finding a suitable vertical profile of the observations in the outer circle. dzmin [m] sets the minimum elevation range required to compute a vertical profile.
num_iterations specifies how many sweeps of all observations will be performed. Observations removed in earlier iterations will not be used in the calculations in later iterations.

| Parameter | Type | Unit | Description |
|---|---|---|---|
| points | Points | Point object with station position | |
| values | vec | ou | Observations |
| num_min_prof | int | Minimum number of observations to compute vertical profile | |
| inner_radius | float | m | Radius for flagging |
| outer_radius | float | m | Radius for computing OI and background |
| min_elev_diff | float | m | Minimum elevation difference to compute vertical profile |
| min_horizontal_scale | float | m | Minimum horizontal decorrelation length |
| vertical_scale | float | m | Vertical decorrelation length |
| pos | vec | Positive deviation allowed | |
| neg | vec | Negative deviation allowed | |
| eps2 | vec | Ratio of observation error variance to background variance (How much is the observation trusted 1: not trusted; 0.1 trusted a lot) | |
| prob_gross_error | vec | Probability of gross error for each observation | |
| rep | vec | Coefficient of representativity | |
| obs_to_check | ivec | Observations that will be checked (since can pass in observations that will not be checked). 1=check the corresponding observation |
ou = Unit of the observation
| Parameter | Type | Unit | Description |
|---|---|---|---|
| flags | ivec | Quality control flag (0=OK, 1=bad) | |
| prob_gross_error | vec | Probability of gross error for each observation | |
| rep | vec | Coefficient of representativity |
pos = np.full(points.size(), 4)
neg = np.full(points.size(), 8)
eps2 = np.full(points.size(), 0.5)

flags, prob, rep = titanlib.sct(points,
    temp_obs,
    5,      # num_min
    100,    # num_max
    50000,  # inner_radius
    150000, # outer_radius
    5,      # num_iterations
    20,     # num_min_prof
    200,    # min_elev_diff
    10000,  # min_horizonal_scale
    200,    # vertical_scale
    pos,
    neg,
    eps2)
# R code
pos <- rep( 4, npoints)
neg <- rep( 8, npoints)
eps2 <- rep( 0.5, npoints)
res <- sct(points, temp_obs,
5, # num_min
100, # num_max
50000, # inner_radius
150000, # outer_radius
5, # num_iterations
20, # num_min_prof
200, # min_elev_diff
10000, # min_horizonal_scale
200, # vertical_scale
pos,
neg,
eps2)
flags <- res[[1]]; prob <- res[[2]]; rep <- res[[3]]Copyright © 2019-2023 Norwegian Meteorological Institute