Maria Guideng
GitHub repo to hold data source and R scripts used for this post: "Accessing SQLite and Querying with DBI in R".
The post provided an analysis demo using flights data in R. Demonstrated how to access an outside SQLite database and run queries using the DBI and RSQLite packages. Performed various data manipulation, summarization, and visualization tasks intended to answer a series of questions related to flights activity at Las Vegas' McCarran International Airport (LAS) and on-time performance to its top destinations.
Q1. Which airports were the busiest, and where did LAS rank? 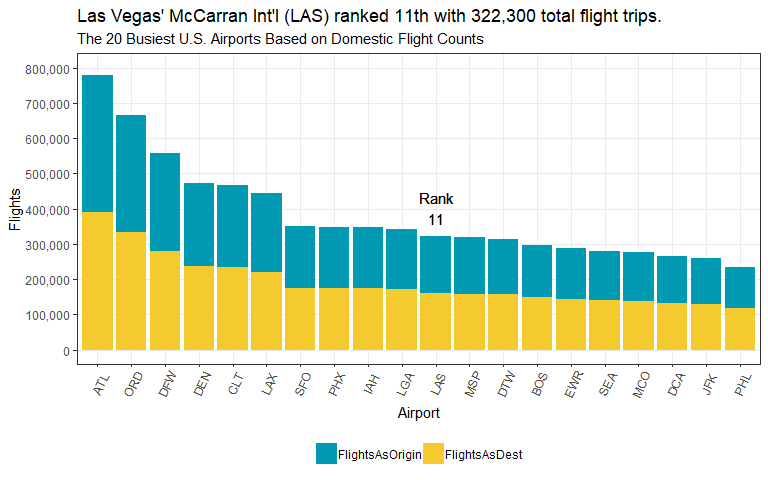
Q2. When were the busiest months for travel at LAS? 
Q3. What were the busiest days of the week at LAS? 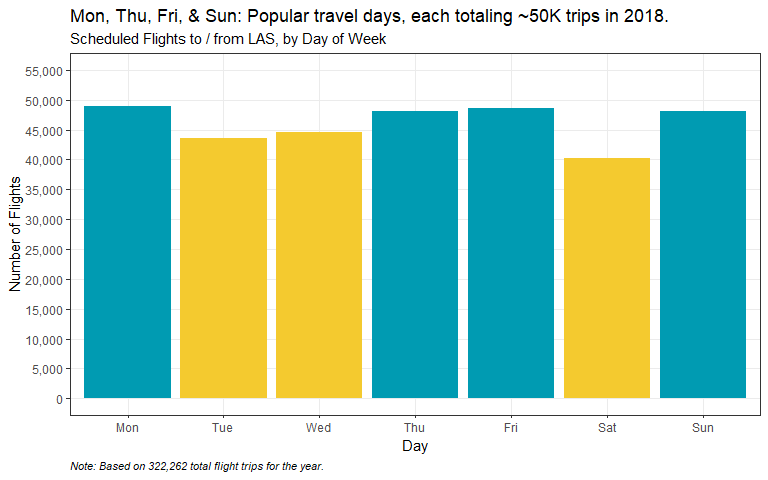
Q4. Which airline carriers serviced the most flights at LAS? 
Q5. Most frequent cities paired with LAS flight trips? 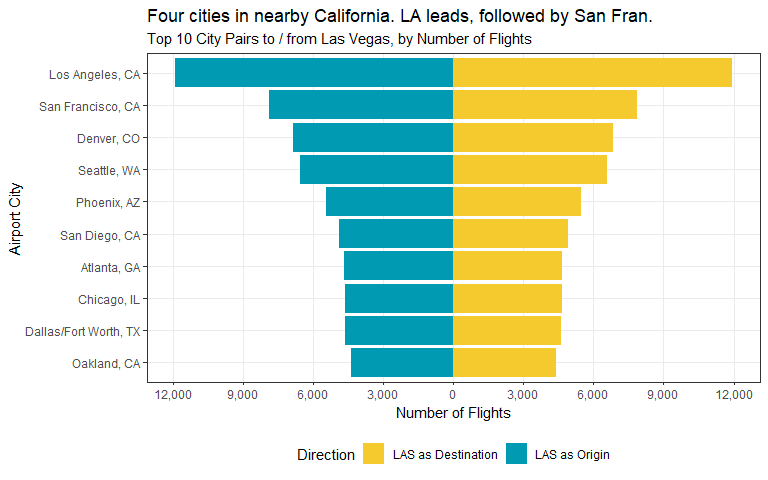
Q6. What share of flights were on time versus delayed? 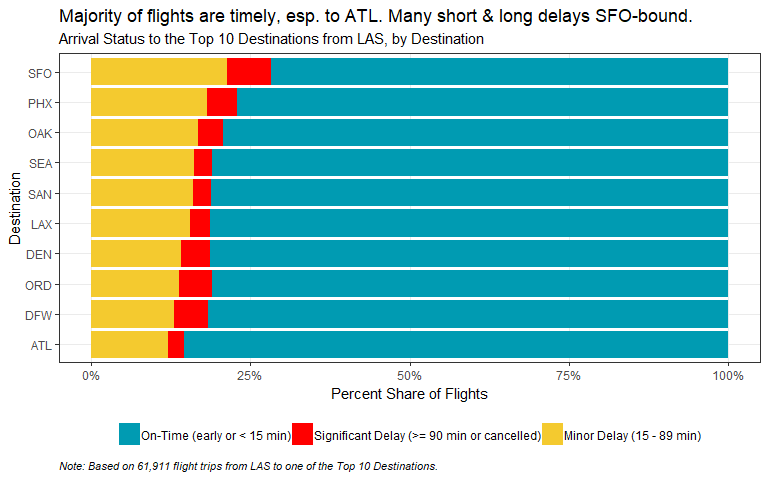
Q7. How many minutes can you expect to be delayed? 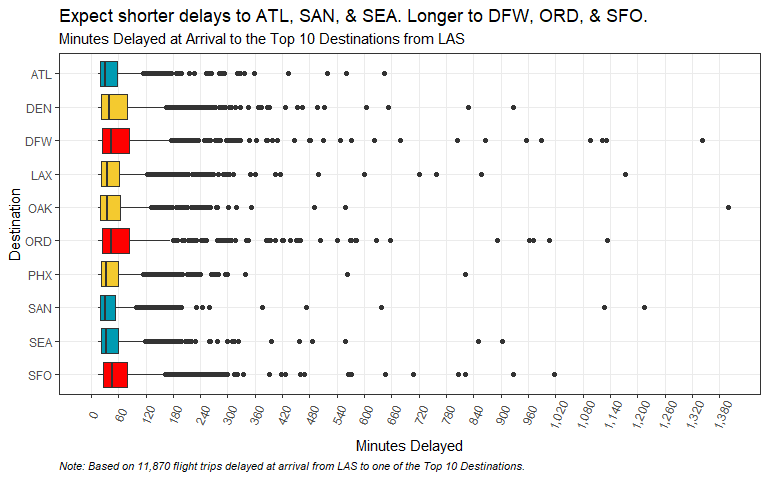
Q8. What were the main reasons for the arrival delays?
Percent of Total Minutes Delayed at Arrival, by Reason:
- Carrier (28.3%)
- Weather (1.3%)
- National Aviation System (28.1%)
- Security (0.1%)
- Late-arriving Aircraft (42.3%)
Q9. What happens when we factor in carriers and airports to the reasons for the delays? 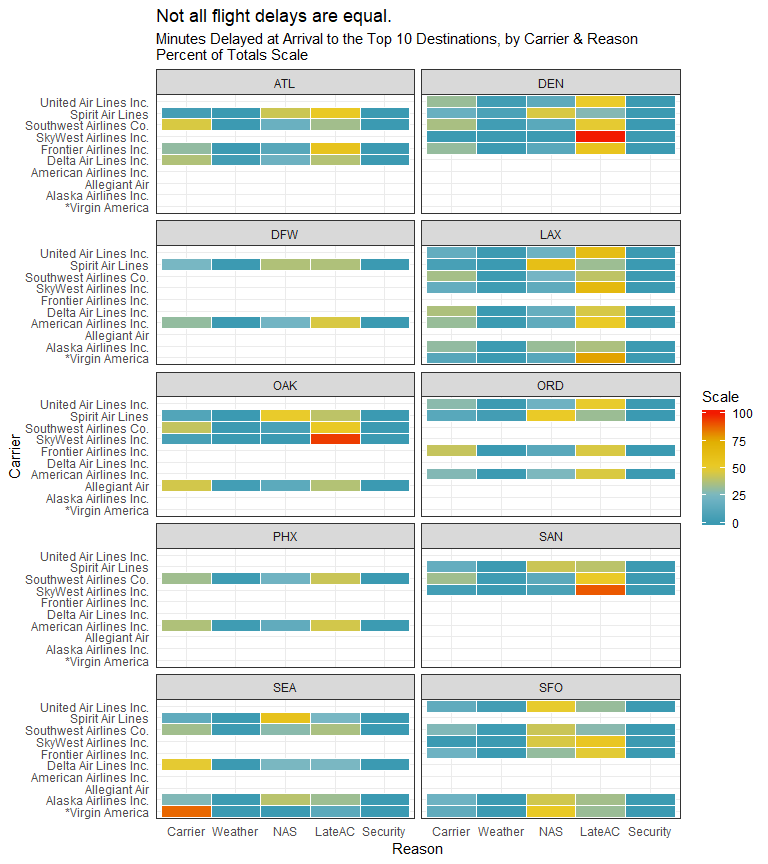
Q10. How often did delayed flights at departure lead to a subsequent delay at arrival?
Of the ~11,800 delayed flights at departure, 80.4 percent saw a subsequent delay at arrival. The remaining 19.6 percent? They were able to recover. This means that one in five flights were able to make up time in the air and arrive to their destinations on time despite departing late from LAS.