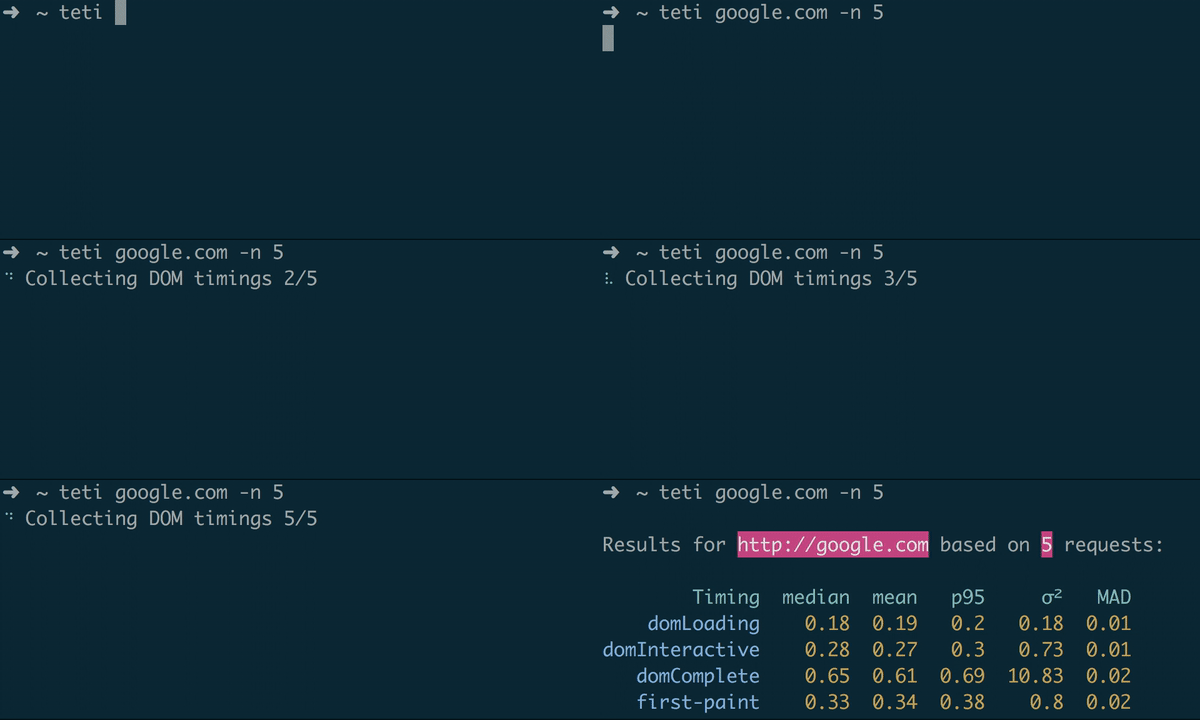
CLI for testing DOM timings built upon Headless Chrome & Lighthouse 💜
npm i -g teti
$ teti --help

Usage
  $ teti <url>

Options
  -n          number of tests to run (10 is default)
  --custom    custom User Timing (performance.mark) to be measured
  --verbose   output all data
➜ teti google.com

Results for http://google.com based on 10 requests:

        Timing  median  mean   p95    σ²   MAD
    domLoading     0.2   0.2  0.22  0.18  0.01
domInteractive    0.29  0.29  0.32  0.36  0.02
   domComplete    0.67  0.68  0.83  3.34  0.03
   first-paint    0.35  0.35   0.4  0.44  0.01
➜ teti https://www.theguardian.com/football -n 30 --custom "commercial boot"

Results for https://www.theguardian.com/football based on 30 requests:

         Timing  median  mean   p95      σ²   MAD
     domLoading    0.16  0.16  0.17    0.03     0
 domInteractive    0.68  0.67   0.8    7.73  0.07
    domComplete    3.42  3.58  4.94  284.16   0.3
    first-paint    0.34  0.34  0.38    0.58  0.01
commercial boot    0.87  0.84  1.06   17.73   0.1
By default teti collects the following timings:
Based on collected data, the following statistical metrics are calculated:
- median
- mean
- p95 - 95th percentile
- σ² - variance
- MAD - median absolute deviation
MIT © Michał Jezierski

