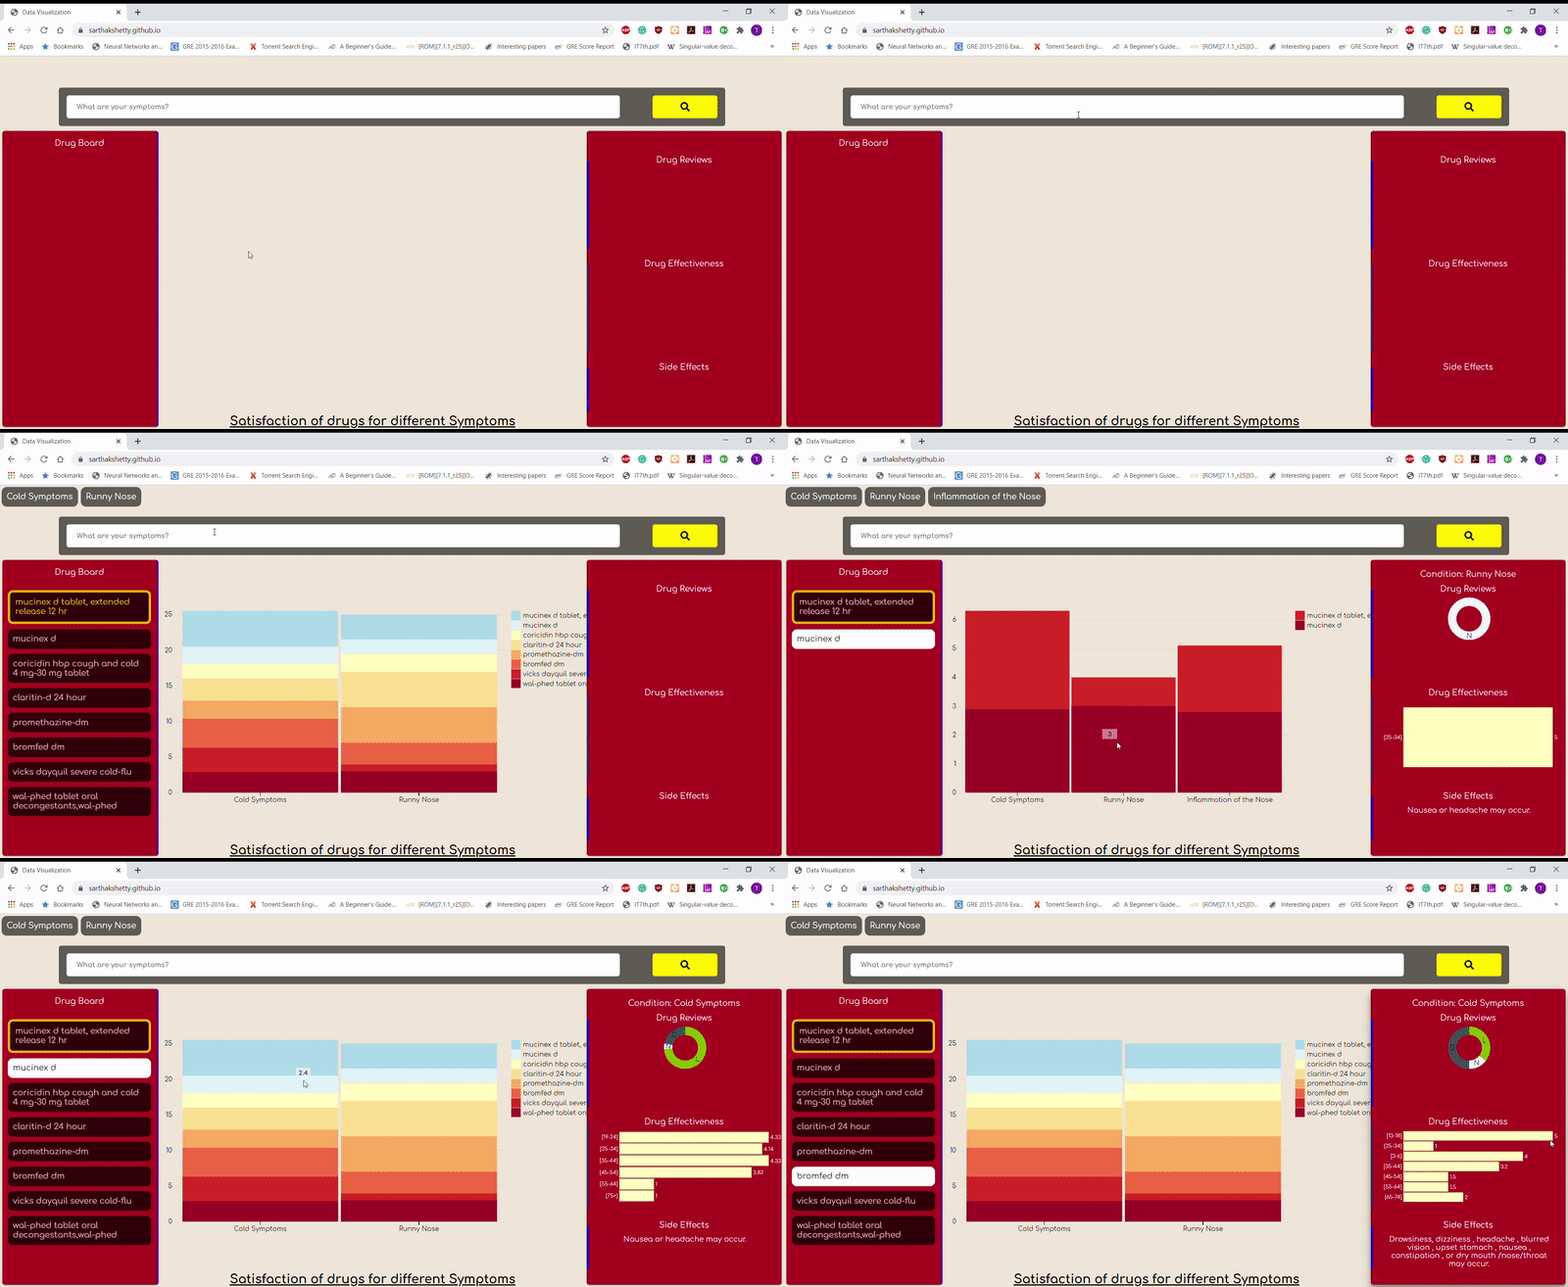
We created a drug recommendation dashboard by leveraging diverse data visualization principles and techniques. It allowed the user to compare drugs for treating a particular condition or combination of conditions entered by the user. Certain interactions were designed to efficiently display the overall average satisfaction, effectiveness and review sentiment of the drugs across different conditions entered. A metric was designed to rank the drugs for making a recommendation, and the visual aids are provided as a proof for supporting recommendation made by the system. Text Sentiment Analysis was performed to display the positive and negative score with the number of such reviews. This project culminated into a tool that helps user understand why the particular drug is best among it’s counterparts.

Link to the Dashboard -> (https://sarthakshetty.github.io/)
- Tanishka Singh
- Aabhaas Gupta
- Sarthak Shetty
- Sumitava Ghosh
- Drug Search Bar: An input text box with search button for user to enter the condition. It comes with a drop down menu that lists the conditions from the dataset. The condition is filtered according to the presence of common drugs between the existing list of searched symptoms. This reduces the load of schema automation according to the Hicks law. The search bar also contains appropriate amount of hint texts to help user navigate with ease.
- Drug Board: This was a space that shows the name of the drugs analyzed in the visualizations and cues, and also ordered according to the metric designed as priority. Hover capabilities on each drug name area is added to switch between drug reviews, age-effectiveness, and side-effects specifics.
- Drug Satisfaction: It show the performance of the drugs as stacked bar graph of every drug for each condition entered by the user in ad hoc manner, while still maintaining the color order of staked bars for aiding comparison across the conditions. We have also placed the labels of the drugs of the same brand names together in the legend,following the Gestalt’s Principle of Proximity.
- Drug Reviews: Sentiment scores are generated using Vader polarity scores, and normalized over the whole comment using the mean valence of phrases and rules decided. The thresholds are used for reducing scores to positive, negative and neutral class of reviews, which are color coded to replicate the overall sentiment.
- Drug Effectiveness: The age reported by reviewers are in the interval data type, which is visualized against effectiveness of the drug for the condition mentioned. The average ratings are presented for comparison as bar chart for each age group.
- Drug Side Effects: By performing word tokenization we summarize all the possible side-effects listed by the reviewers. The list is converted to set, for eliminating duplicates, and then displayed to user on hover.