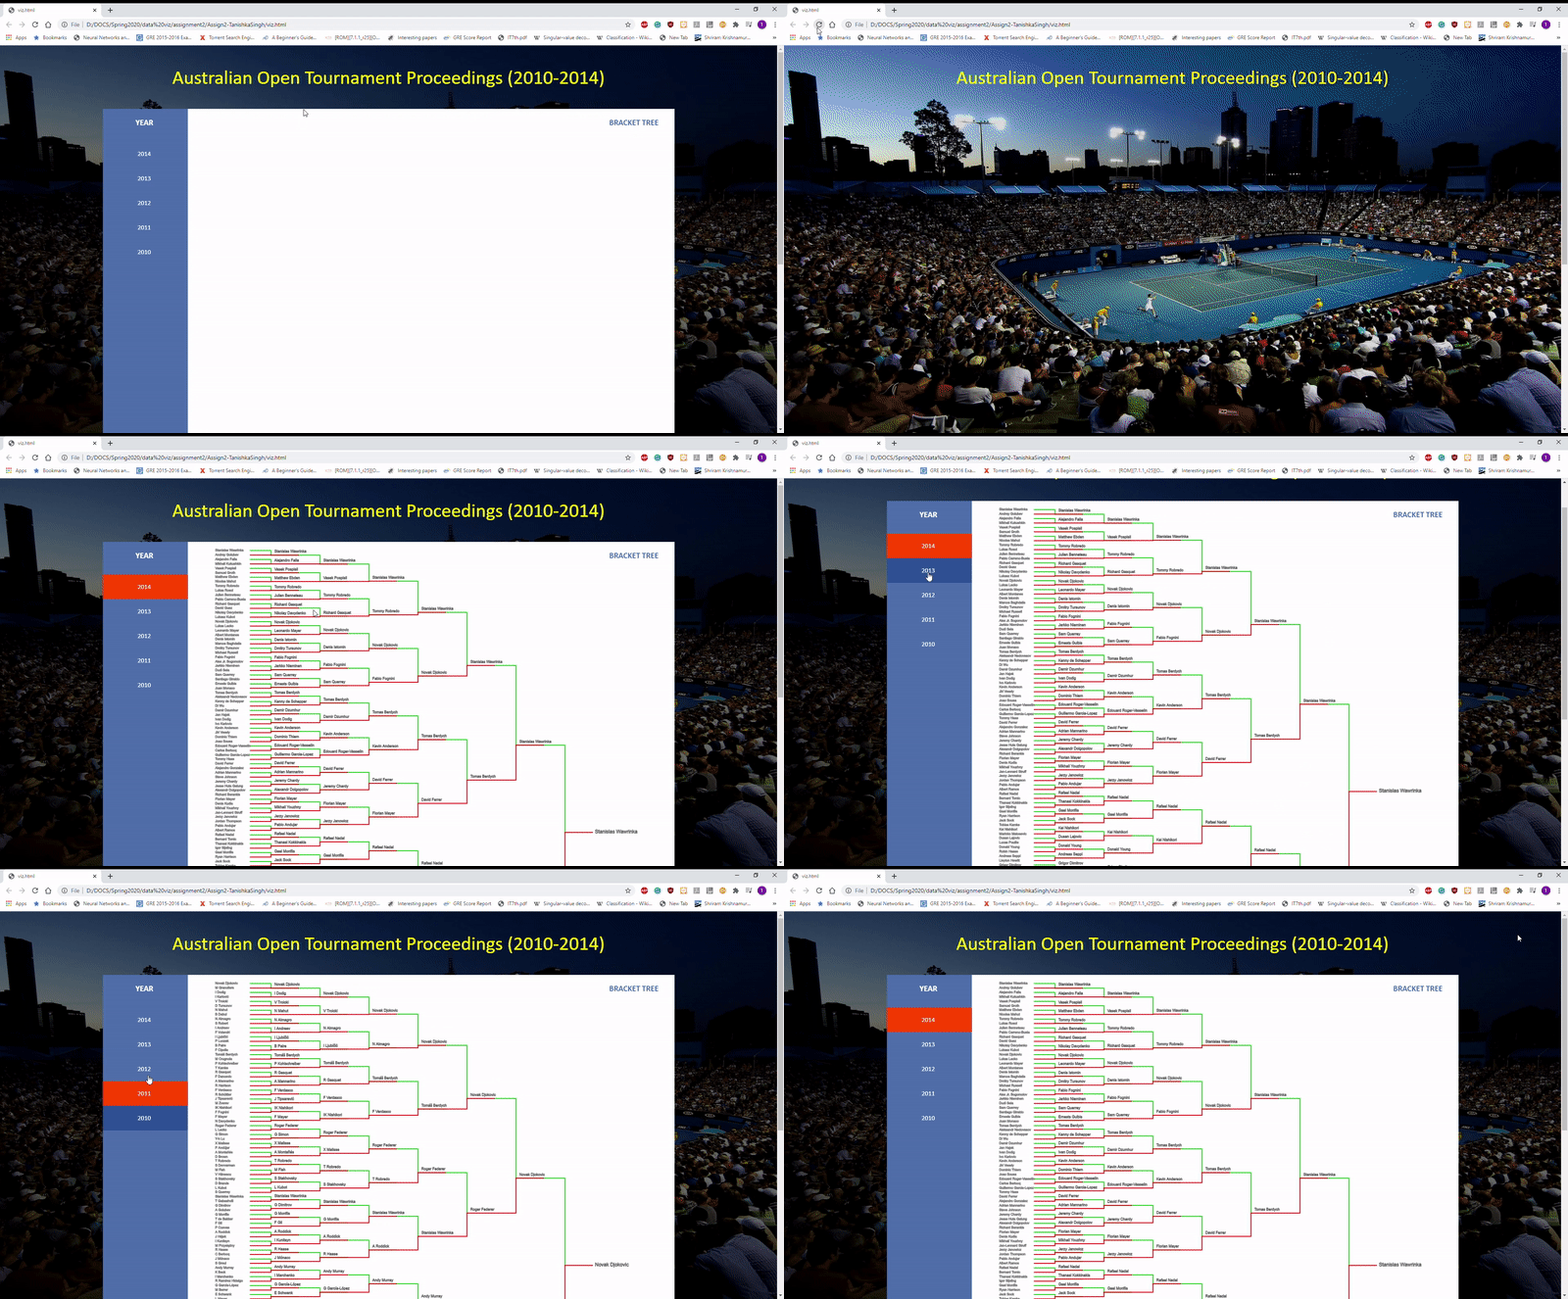
The idea for my application was to allow user to view the Bracket Tree of every year (2010-2014). This will particularly help users know the following aspects:
- Players that won or lost in each round, for every AUS open.
- What players did the winner beat to win AUS open for each year.
- What are best performing players of each year, across year.
I used HTML, CSS, D3, and JavaScript for this Assignment, few notable elements used:
- D3.tree
- D3.hierarchy
- Path and text SVG components
- D3.transitions, mouse events
- Z-index
Moreover, the path lines for the bracket tree are color coded red and green in addition to showing which player won a round, making it easier to follow a branch (starting any round) to the first round match for the year. Some improvements that can be made is having interactions showing match performance variables for everyone on hover. Size of final winner is increased to be more intuitive. For running the application, open viz.html; no path required for data as the file is enough to run visualizations standalone. Click on year to view the bracket tree for that year.
