-
Notifications
You must be signed in to change notification settings - Fork 237
Perf
The clBLAS client program is found in the ./src/client subdirectory. This program is more than just a sample application demonstrating the use of the BLAS library. The client program supports various capabilities including performance measurement. In general, the client program can invoke a user specified type of BLAS operation and report its performance.
The block below shows the help message given by the client program listing all the command line options. These options can be used to input various parameters and control the type of BLAS operation.
F:\code\GitHub\kknox\bin\clBLAS\develop\vs10x64\package\bin64> .\client.exe --help
clBLAS client command line options:
  -h [ --help ]                 produces this help message
  -g [ --gpu ]                  Force instantiation of an OpenCL GPU device
  -c [ --cpu ]                  Force instantiation of an OpenCL CPU device
  -a [ --all ]                  Force instantiation of all OpenCL devices
  --useimages                   Use an image-based kernel
  -m [ --sizem ] arg (=128)     number of rows in A and C
  -n [ --sizen ] arg (=128)     number of columns in B and C
  -k [ --sizek ] arg (=128)     number of columns in A and rows in B
  --lda arg (=0)                first dimension of A in memory. if set to 0,
                                lda will default to M (when transposeA is "no
                                transpose") or K (otherwise)
  --ldb arg (=0)                first dimension of B in memory. if set to 0,
                                ldb will default to K (when transposeB is "no
                                transpose") or N (otherwise)
  --ldc arg (=0)                first dimension of C in memory. if set to 0,
                                ldc will default to M
  --offA arg (=0)               offset of the matrix A in memory object
  --offBX arg (=0)              offset of the matrix B or vector X in memory
                                object
  --offCY arg (=0)              offset of the matrix C or vector Y in memory
                                object
  --alpha arg (=1)              specifies the scalar alpha
  --beta arg (=1)               specifies the scalar beta
  -o [ --order ] arg (=0)       0 = row major, 1 = column major
  --transposeA arg (=0)         0 = no transpose, 1 = transpose, 2 = conjugate
                                transpose
  --transposeB arg (=0)         0 = no transpose, 1 = transpose, 2 = conjugate
                                transpose
  -f [ --function ] arg (=gemm) BLAS function to test. Options: gemm, trsm,
                                trmm, gemv, symv, syrk, syr2k
  -r [ --precision ] arg (=s)   Options: s,d,c,z
  --side arg (=0)               0 = left, 1 = right. only used with [list of
                                function families]
  --uplo arg (=0)               0 = upper, 1 = lower. only used with [list of
                                function families]
  --diag arg (=0)               0 = unit diagonal, 1 = non unit diagonal. only
                                used with [list of function families]
  -p [ --profile ] arg (=20)    Time and report the kernel speed (default:
                                profiling off)
Examples are shown below; first example is invoking a single precision GEMM routine. All values are at their defaults.
F:\code\GitHub\kknox\bin\clBLAS\develop\vs10x64\package\bin64> .\client.exe
        StatisticalTimer:: Pruning 0 samples from clfunc
        StatisticalTimer:: Pruning 0 samples from clGemm
BLAS kernel execution time < ns >: 241963
BLAS kernel execution Gflops < 2.0*M*N*K/time >: 17.3345
Next example shows a 2048x2048 double precision TRSM routine with A as an upper-triangular non-unit diagonal matrix reporting the average time of 20 runs with outliers pruned.
F:\code\GitHub\kknox\bin\clBLAS\develop\vs10x64\package\bin64> .\client.exe -m 2048 -n 2048 -f trsm --uplo 1 --diag 1 -r d -p 20
        StatisticalTimer:: Pruning 0 samples from clfunc
        StatisticalTimer:: Pruning 0 samples from clTrsm
BLAS kernel execution time < ns >: 5.03849e+007
BLAS kernel execution Gflops < M*(M+1)*N/time >: 170.569
Python version 2.7.x is supported.
To use these scripts, you will need to download and install the 32-BIT VERSION of:
- Python 2.7 x86 (32-bit) - http://www.python.org/download/releases/2.7.1
you will also need the 32-BIT VERSIONS of the following packages as not all the packages are available in 64bit at the time of this writing The ActiveState python distribution is recommended for windows (make sure to get the python 2.7-compatible packages):
-
NumPy 1.5.1 (32-bit, 64-bit unofficial, supports Python 2.4 - 2.7 and 3.1 - 3.2.) - http://sourceforge.net/projects/numpy/files/NumPy/
-
matplotlib 1.0.1 (32-bit & 64-bit, supports Python 2.4 - 2.7) - http://sourceforge.net/projects/matplotlib/files/matplotlib/
For ActiveState Python, all that one should need to type is 'pypm install matplotlib'
While it is convenient to be able to time a particular function with a given set of parameters, it is even better to be able to generate a plot of performance over a range of parameters. clBLAS can generate performance plots with the help of Python scripts. The python scripts are located at ./src/scripts/perf, but when the INSTALL target is built from the build environment the scripts are copied into the ./bin/clBLAS/develop/vs10x64/package directory along with the rest of the built binaries.
The are two primary python scripts that are user interactable.
This script is responsible for measuring, gathering performance data and recording it in a log file. This script calls the client program in a loop, modifying program parameters in an organized fashion and scrapes stdOut for performance information. It provides a sophisticated interface that simplifies specifying test ranges and strides. It provides for extensive help information with the --help parameter
F:\code\GitHub\kknox\bin\clBLAS\develop\vs10x64\package\bin64> python .\measurePerformance.py --help
usage: measurePerformance.py [-h] [--device DEVICE] [-m SIZEM]
                                       [-n SIZEN] [-k SIZEK] [-s SQUARE]
                                       [--problemsize PROBLEMSIZE] [--lda LDA]
                                       [--ldb LDB] [--ldc LDC] [--offa OFFA]
                                       [--offb OFFB] [--offc OFFC] [-a ALPHA]
                                       [-b BETA] [-f FUNCTION] [-r PRECISION]
                                       [-o ORDER] [--transa TRANSA]
                                       [--transb TRANSB] [--side SIDE]
                                       [--uplo UPLO] [--diag DIAG]
                                       [--library LIBRARY] [--label LABEL]
                                       [--tablefile TABLEOUTPUTFILENAME]
                                       [--createini CREATEINIFILENAME | --ini USEINIFILENAME]

Measure performance of the clAmdBlas library

optional arguments:
  -h, --help            show this help message and exit
  --device DEVICE       device(s) to run on; may be a comma-delimited list.
                        choices are ['gpu', 'cpu']. (default gpu)
  -m SIZEM, --sizem SIZEM
                        size(s) of m to test; may include ranges and comma-
                        delimited lists. stepping may be indicated with a
                        colon. e.g., 1024 or 100-800:100 or 15,2048-3000
  -n SIZEN, --sizen SIZEN
                        size(s) of n to test; may include ranges and comma-
                        delimited lists. stepping may be indicated with a
                        colon. e.g., 1024 or 100-800:100 or 15,2048-3000
  -k SIZEK, --sizek SIZEK
                        size(s) of k to test; may include ranges and comma-
                        delimited lists. stepping may be indicated with a
                        colon. e.g., 1024 or 100-800:100 or 15,2048-3000
  -s SQUARE, --square SQUARE
                        size(s) of m=n=k to test; may include ranges and
                        comma-delimited lists. stepping may be indicated with
                        a colon. this option sets lda = ldb = ldc to the
                        values indicated with --lda for all problems set with
                        --square. e.g., 1024 or 100-800:100 or 15,2048-3000
  --problemsize PROBLEMSIZE
                        additional problems of a set size. may be used in
                        addition to sizem/n/k and lda/b/c. each indicated
                        problem size will be added to the list of problems to
                        complete. should be entered in MxNxK:AxBxC format
                        (where :AxBxC specifies lda/b/c. :AxBxC is optional.
                        if included, lda/b/c are subject to the same range
                        restrictions as indicated in the lda/b/c section of
                        this help. if omitted, :0x0x0 is assumed). may enter
                        multiple in a comma-delimited list. e.g.,
                        2x2x2:4x6x9,3x3x3 or 1024x800x333
  --lda LDA             value of lda; may include ranges and comma-delimited
                        lists. stepping may be indicated with a colon. if
                        transA = 'n', lda must be >= 'm'. otherwise, lda must
                        be >= 'k'. if this is violated, the problem will be
                        skipped. if lda is 0, it will be automatically set to
                        match either 'm' (if transA = 'n') or 'k' (otherwise).
                        may indicate relative size with +X, where X is the
                        offset relative to M or K (depending on transA). e.g.,
                        1024 or 100-800:100 or 15,2048-3000 or +10 (if transA
                        = 'n' and M = 100, lda = 110) (default 0)
  --ldb LDB             value of ldb; may include ranges and comma-delimited
                        lists. stepping may be indicated with a colon. if
                        transB = 'n', ldb must be >= 'k'. otherwise, ldb must
                        be >= 'n'. if this is violated, the problem will be
                        skipped. if ldb is 0, it will be automatically set to
                        match either 'k' (if transB = 'n') or 'n' (otherwise).
                        may indicate relative size with +X, where X is the
                        offset relative to K or N (depending on transB). e.g.,
                        1024 or 100-800:100 or 15,2048-3000 or +100 (if transB
                        = 'n' and K = 2000, ldb = 2100) (default 0)
  --ldc LDC             value of ldc; may include ranges and comma-delimited
                        lists. stepping may be indicated with a colon. ldc
                        must be >= 'm'. if this is violated, the problem will
                        be skipped. if ldc is 0, it will be automatically set
                        to match 'm'. may indicate relative size with +X,
                        where X is the offset relative to M. e.g., 1024 or
                        100-800:100 or 15,2048-3000 or +5 (if M = 15, ldc =
                        20) (default 0)
  --offa OFFA           offset of the matrix A in memory; may include ranges
                        and comma-delimited lists. stepping may be indicated
                        with a colon. e.g., 0-31 or 100-128:2 or 42 (default
                        0)
  --offb OFFB           offset of the matrix B or vector X in memory; may
                        include ranges and comma-delimited lists. stepping may
                        be indicated with a colon. e.g., 0-31 or 100-128:2 or
                        42 (default 0)
  --offc OFFC           offset of the matrix C or vector Y in memory; may
                        include ranges and comma-delimited lists. stepping may
                        be indicated with a colon. e.g., 0-31 or 100-128:2 or
                        42 (default 0)
  -a ALPHA, --alpha ALPHA
                        specifies the scalar alpha
  -b BETA, --beta BETA  specifies the scalar beta
  -f FUNCTION, --function FUNCTION
                        indicates the function(s) to use. may be a comma
                        delimited list. choices are ['gemm', 'trmm', 'trsm',
                        'syrk', 'syr2k', 'gemv', 'symv'] (default gemm)
  -r PRECISION, --precision PRECISION
                        specifies the precision for the function. may be a
                        comma delimited list. choices are ['s', 'd', 'c', 'z']
                        (default s)
  -o ORDER, --order ORDER
                        select row or column major. may be a comma delimited
                        list. choices are ['row', 'column'] (default row)
  --transa TRANSA       select none, transpose, or conjugate transpose for
                        matrix A. may be a comma delimited list. choices are
                        ['none', 'transpose', 'conj'] (default none)
  --transb TRANSB       select none, transpose, or conjugate transpose for
                        matrix B. may be a comma delimited list. choices are
                        ['none', 'transpose', 'conj'] (default none)
  --side SIDE           select side, left or right for TRMM and TRSM. may be a
                        comma delimited list. choices are ['left', 'right']
                        (default left)
  --uplo UPLO           select uplo, upper or lower triangle. may be a comma
                        delimited list. choices are ['upper', 'lower']
                        (default upper)
  --diag DIAG           select diag, whether set diagonal elements to one. may
                        be a comma delimited list. choices are ['unit',
                        'nonunit'] (default unit)
  --library LIBRARY     indicates the library to use. choices are
                        ['clamdblas'] (default clamdblas)
  --label LABEL         a label to be associated with all transforms performed
                        in this run. if LABEL includes any spaces, it must be
                        in "double quotes". note that the label is not saved
                        to an .ini file. e.g., --label cayman may indicate
                        that a test was performed on a cayman card or --label
                        "Windows 32" may indicate that the test was performed
                        on Windows 32
  --tablefile TABLEOUTPUTFILENAME
                        save the results to a plaintext table with the file
                        name indicated. this can be used with
                        plotPerformance.py to generate graphs of the
                        data (default: table prints to screen)
  --createini CREATEINIFILENAME
                        create an .ini file with the given name that saves the
                        other parameters given at the command line, then quit.
                        e.g., 'measurePerformance.py -m 10 -n 100 -k
                        1000-1010 -f sgemm --createini my_favorite_setup.ini'
                        will create an .ini file that will save the
                        configuration for an sgemm of the indicated sizes.
  --ini USEINIFILENAME  use the parameters in the named .ini file instead of
                        the command line parameters.
An example of using this script to gather data is illustrated below; run gemm (the default) for single precision (default) square shapes for all power-of-2 sizes between 64 to 1024
F:\code\GitHub\kknox\bin\clBLAS\develop\vs10x64\package\bin64> python .\measurePerformance.py -s 64-1024:x2
A subdirectory or file perfLog already exists.
=========================MEASURE PERFORMANCE START===========================
Process id of Measure Performance:4988
Executing measure performance for label: None
Total combinations = 5
preparing command: 1
Executing Command: ['client.exe', '--gpu', '-m', '64', '-n', '64', '-k', '64', '--lda', '0', '--ldb', '0'
, '--ldc', '0', '--offA', '0', '--offBX', '0', '--offCY', '0', '--alpha', '1.0', '--beta', '1.0', '--order', '0', '
--transposeA', '0', '--transposeB', '0', '--side', '0', '--uplo', '0', '--diag', '0', '--function', 'gemm', '--prec
ision', 's', '-p', '10']
stdout:
BLAS kernel execution time < ns >: 168078
BLAS kernel execution Gflops < 2.0*M*N*K/time >: 3.11932

stderr:
        StatisticalTimer:: Pruning 0 samples from clfunc
        StatisticalTimer:: Pruning 0 samples from clGemm

Execution Successfull---------------

preparing command: 2
Executing Command: ['client.exe', '--gpu', '-m', '128', '-n', '128', '-k', '128', '--lda', '0', '--ldb',
'0', '--ldc', '0', '--offA', '0', '--offBX', '0', '--offCY', '0', '--alpha', '1.0', '--beta', '1.0', '--order', '0'
, '--transposeA', '0', '--transposeB', '0', '--side', '0', '--uplo', '0', '--diag', '0', '--function', 'gemm', '--p
recision', 's', '-p', '10']
stdout:
BLAS kernel execution time < ns >: 241691
BLAS kernel execution Gflops < 2.0*M*N*K/time >: 17.354

stderr:
        StatisticalTimer:: Pruning 0 samples from clfunc
        StatisticalTimer:: Pruning 0 samples from clGemm

Execution Successfull---------------
This generates a log file in the current directory that contains the details of all the parameters testes with the performance number
F:\code\GitHub\kknox\bin\clBLAS\develop\vs10x64\package\bin64> cat .\results2013-07-19T10.27.42.487000.txt
m,n,k,lda,ldb,ldc,offa,offb,offc,alpha,beta,order,transa,transb,side,uplo,diag,function,device,library,label,GFLOPS
64,64,64,0,0,0,0,0,0,1.0,1.0,row,none,none,left,upper,unit,sgemm,gpu,clblas,None,3.11932
128,128,128,0,0,0,0,0,0,1.0,1.0,row,none,none,left,upper,unit,sgemm,gpu,clblas,None,17.354
256,256,256,0,0,0,0,0,0,1.0,1.0,row,none,none,left,upper,unit,sgemm,gpu,clblas,None,82.6617
512,512,512,0,0,0,0,0,0,1.0,1.0,row,none,none,left,upper,unit,sgemm,gpu,clblas,None,327.464
1024,1024,1024,0,0,0,0,0,0,1.0,1.0,row,none,none,left,upper,unit,sgemm,gpu,clblas,None,867.143
This log file is then fed into the plotPerformance.py script, which consumes the records and plots the results in a graph.
While the logfile generated from measurePerformance is sufficient for gathering performance data, it is nice to be able to generate plots with the data to be able to easily compare and contrast different sets of data. This is the purpose of plotPerformance.py; this python script uses the python matplotlib ( freely available ) library to either open a window into an interactive graph, or create an image file straight to disk. It provides for extensive help information with the --help parameter
F:\code\GitHub\kknox\bin\clBLAS\develop\vs10x64\package\bin64> python .\plotPerformance.py --help
usage: plotPerformance.py [-h] -d DATAFILE -x {sizem,sizen,sizek}
                                    [-y {gflops}]
                                    [--plot {lda,ldb,ldc,sizek,device,label,order,transa,transb,function,library}]
                                    [--title GRAPHTITLE]
                                    [--x_axis_label XAXISLABEL]
                                    [--x_axis_scale {linear,log2,log10}]
                                    [--y_axis_label YAXISLABEL]
                                    [--outputfile OUTPUTFILENAME]

Plot performance of the clBLAS library. plotPerformance.py reads
in data tables from  measurePerformance.py and plots their values

optional arguments:
  -h, --help            show this help message and exit
  -d DATAFILE, --datafile DATAFILE
                        indicate a file to use as input. must be in the format
                        output by measurePerformance.py. may be used
                        multiple times to indicate multiple input files. e.g.,
                        -d cypressOutput.txt -d caymanOutput.txt
  -x {sizem,sizen,sizek}, --x_axis {sizem,sizen,sizek}
                        indicate which value will be represented on the x
                        axis. problemsize is defined as x*y*z*batchsize
  -y {gflops}, --y_axis {gflops}
                        indicate which value will be represented on the y axis
  --plot {lda,ldb,ldc,sizek,device,label,order,transa,transb,function,library}
                        indicate which of ['lda', 'ldb', 'ldc', 'sizek',
                        'device', 'label', 'order', 'transa', 'transb',
                        'function', 'library'] should be used to differentiate
                        multiple plots. this will be chosen automatically if
                        not specified
  --title GRAPHTITLE    the desired title for the graph generated by this
                        execution. if GRAPHTITLE contains any spaces, it must
                        be entered in "double quotes". if this option is not
                        specified, the title will be autogenerated
  --x_axis_label XAXISLABEL
                        the desired label for the graph's x-axis. if
                        XAXISLABEL contains any spaces, it must be entered in
                        "double quotes". if this option is not specified, the
                        x-axis label will be autogenerated
  --x_axis_scale {linear,log2,log10}
                        the desired scale for the graph's x-axis. if nothing
                        is specified, it will be selected automatically
  --y_axis_label YAXISLABEL
                        the desired label for the graph's y-axis. if
                        YAXISLABEL contains any spaces, it must be entered in
                        "double quotes". if this option is not specified, the
                        y-axis label will be autogenerated
  --outputfile OUTPUTFILENAME
                        name of the file to output graphs. Supported formats:
                        emf, eps, pdf, png, ps, raw, rgba, svg, svgz.
Once the performance of a particular run has been saved to a log file, you can instruct plotPerformance to parse the log file and create a line graph from that data. Multiple log files can be read, and this creates the ability to compare numbers easily against each other.
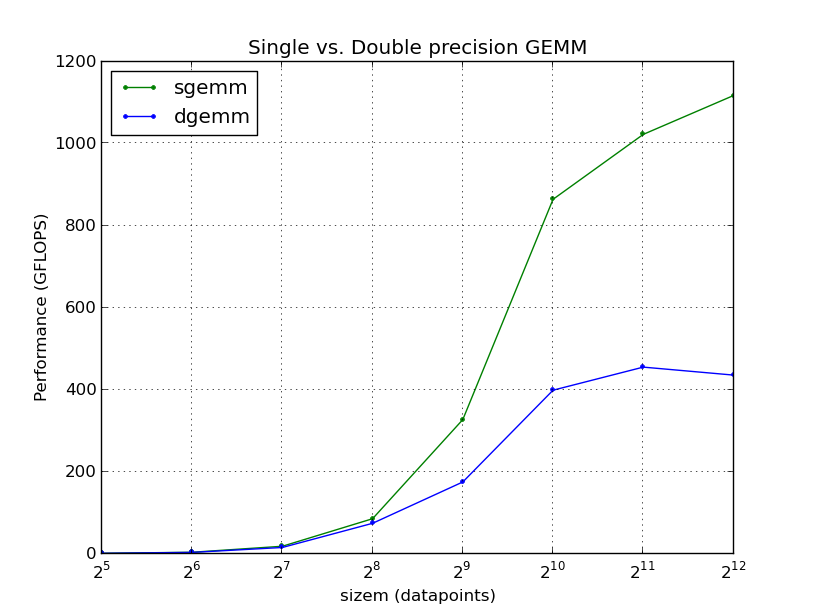
The graph below compares the single and double precision performance of a GEMM function
F:\code\GitHub\kknox\bin\clBLAS\develop\vs10x64\package\bin64> python .\plotPerformance.py -x sizem --plot function -d .\results2013-07-19T13.52.41.272000.txt -d .\results2013-07-19T13.53.26.528000.txt --title "Single vs. Double precision GEMM"
m,n,k,lda,ldb,ldc,offa,offb,offc,alpha,beta,order,transa,transb,side,uplo,diag,function,device,library,label,GFLOPS
m,n,k,lda,ldb,ldc,offa,offb,offc,alpha,beta,order,transa,transb,side,uplo,diag,function,device,library,label,GFLOPS

True
m,n,k,lda,ldb,ldc,offa,offb,offc,alpha,beta,order,transa,transb,side,uplo,diag,function,device,library,label,GFLOPS
m,n,k,lda,ldb,ldc,offa,offb,offc,alpha,beta,order,transa,transb,side,uplo,diag,function,device,library,label,GFLOPS

True
and the graph should look very similar to
For AMD's NDA customers, there are optimized OpenCL compiler flags which are only usable by the NDA driver and therefore only available to NDA customers. The flags/driver combination improves performance of sgemm and dgemm.
For AMD's NDA customers, there is proprietary tool to set the GPU clock stable. This tool is required to achieve optimal and stable performance.
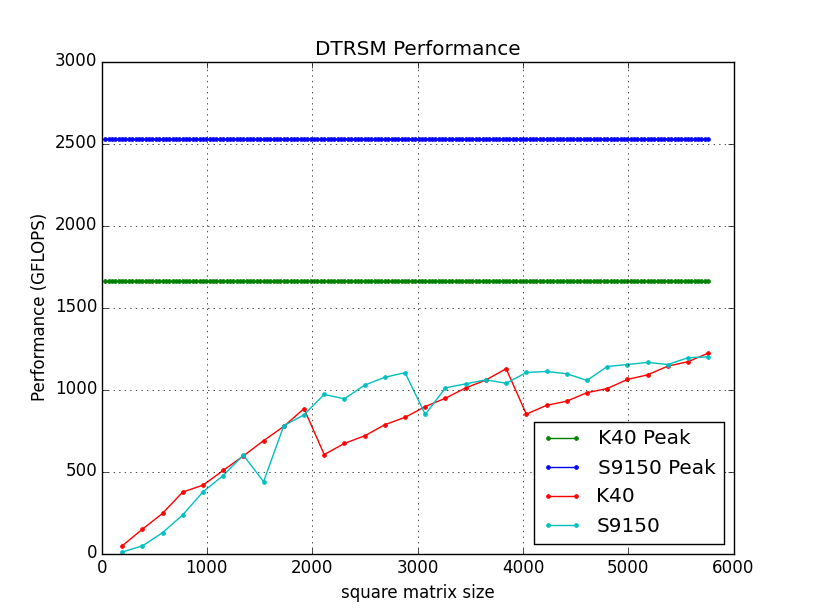
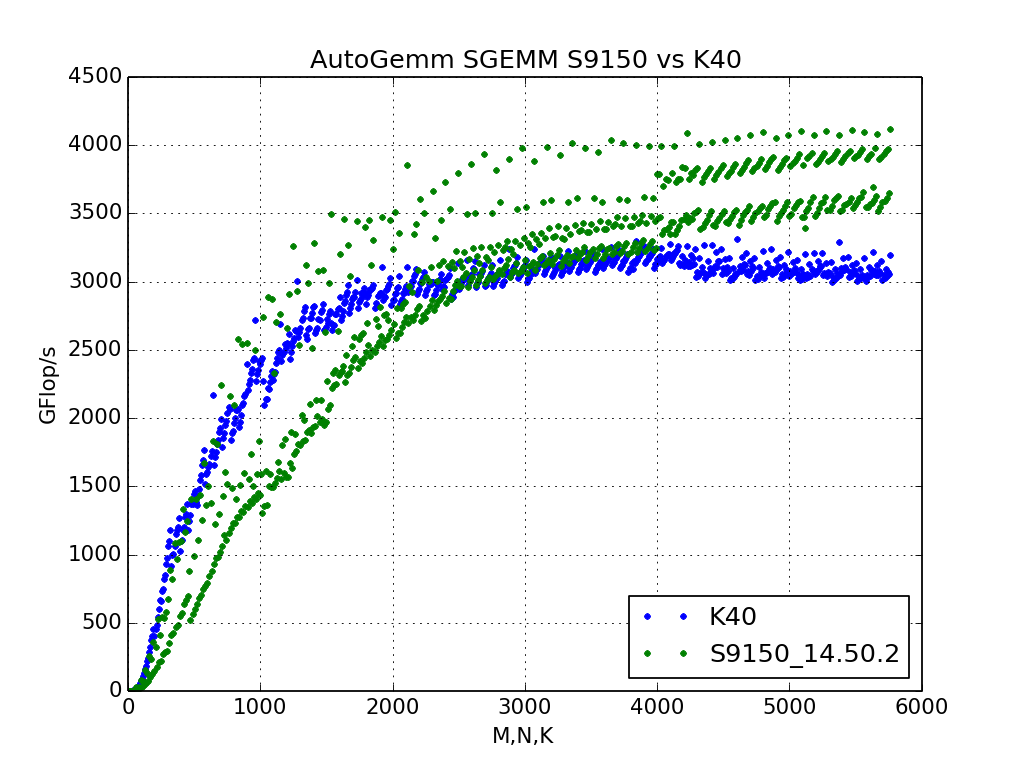
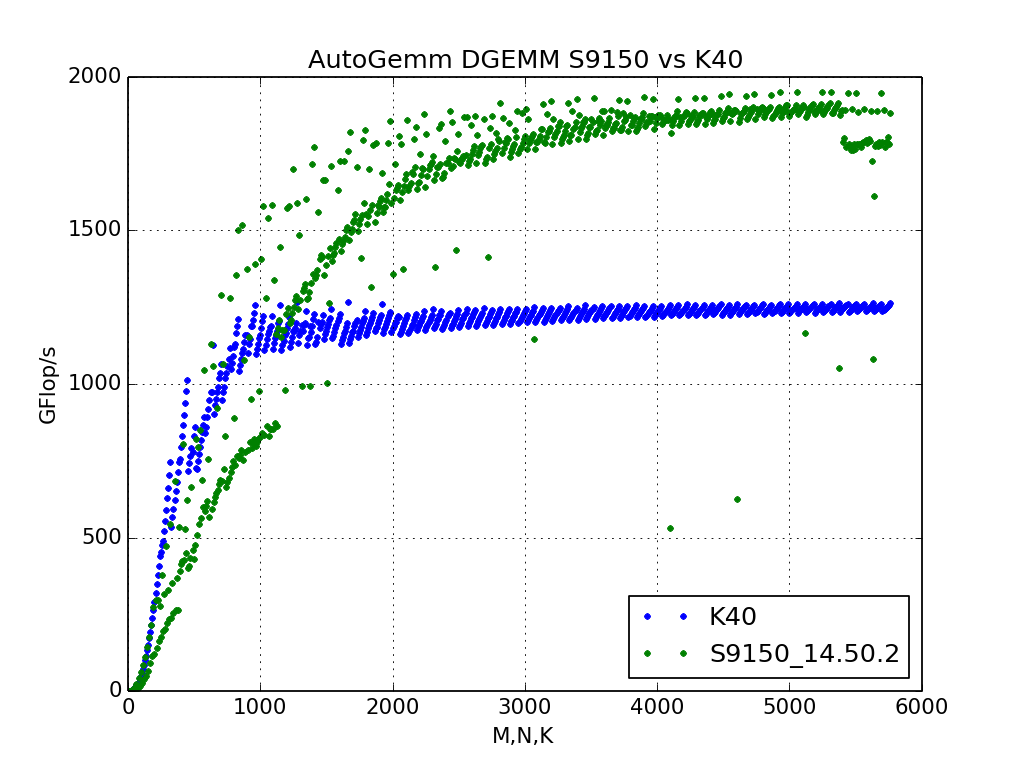
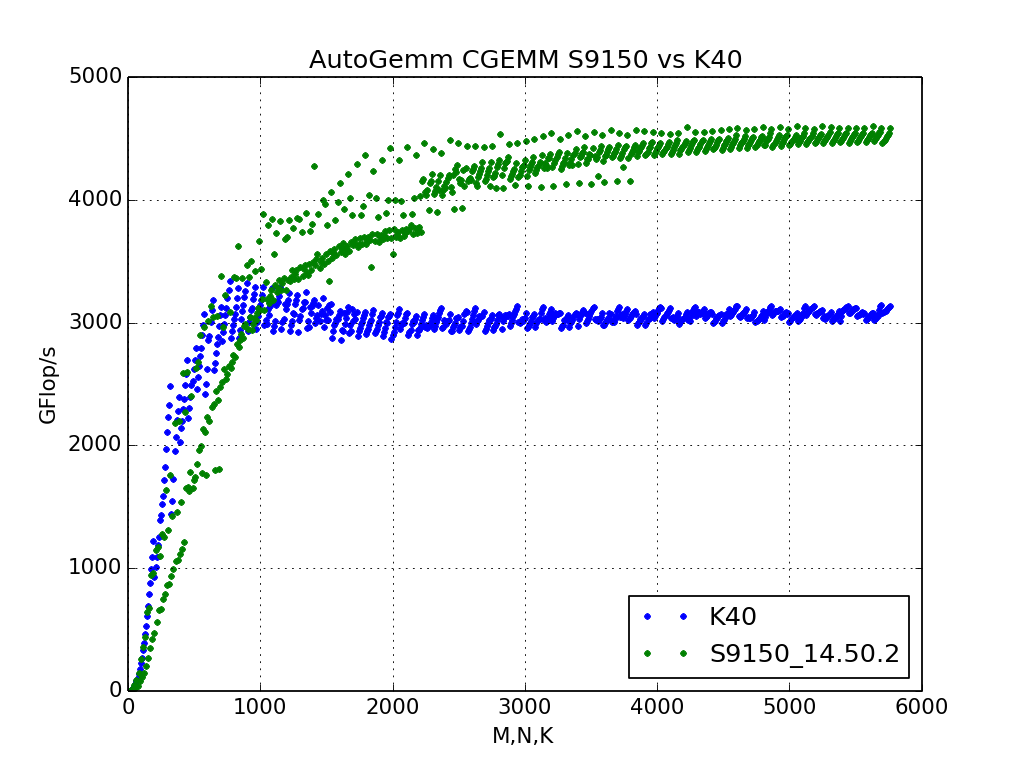
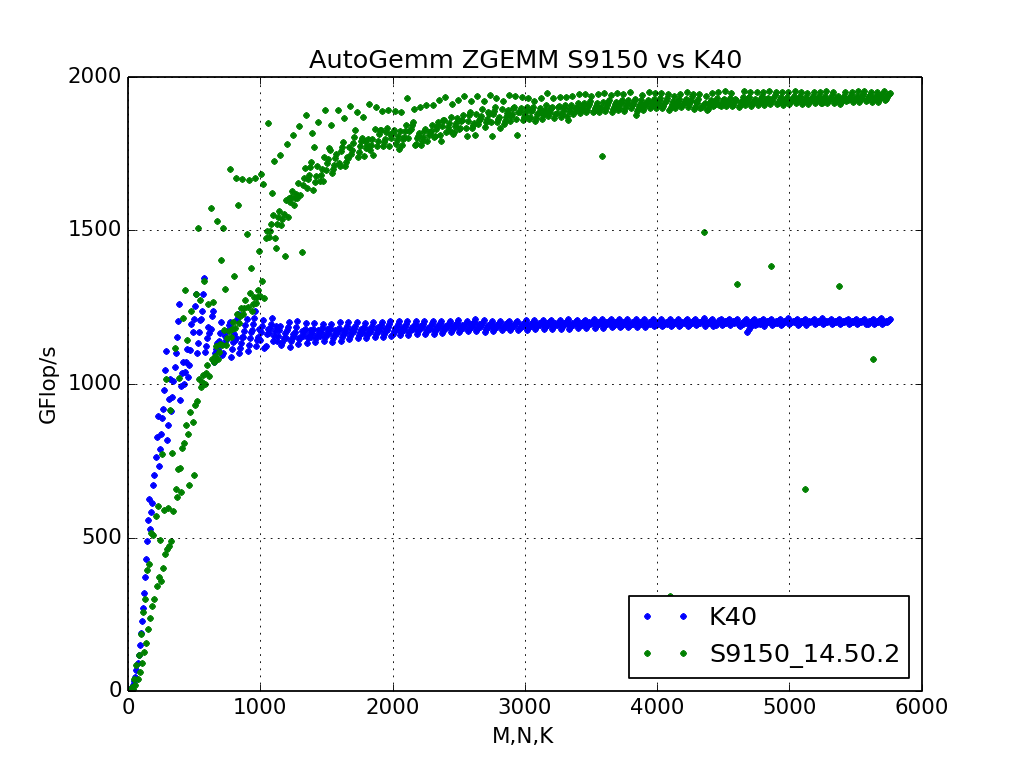
Below are some graphs showing clBLAS 2.8.0 performance on s9150 with 14.50.2 driver as well as cuBLAS 7.5 performance on K40. GPU clock speeds were set to max for both devices.
SGEMM
DGEMM
CGEMM
ZGEMM
DTRSM
